Training with Power
This is my first year training with a power meter. It is quite a change from just measuring speed or heart rate. For one thing, all those books that talk about power all of a sudden make sense, and it becomes pretty obvious pretty quickly why most cycling coaches have gone to power as the primary tool for performance measurement: it doesn’t care. The power meter doesn’t care if you’re tired or if the weather is terrible. It doesn’t care if you’re doing your bike after 4 kms in the pool so your heart rate is already starting to drift. It knows the difference between an uphill and a downhill, even if you can’t see it. It is a measurement of the power you are putting into the pedals and therefore the wheels regardless of any other external factor. That’s what makes it so useful.
The first thing that my power meter has taught me is that I start way too hard. Since the overall power intensity factor of any given workout is cumulative it can be really hard to recover to a manageable training stress over the rest of the workout. Go out on the bike too hard and good luck running it home. For example, if I head out on a ride just using heart rate and perceived exertion, I tend to start out pedalling at about 83% of my functional threshold. That’s just what my body and mind perceive as the right “race pace.” But of course, over the long course, that dribbles down to about 50%. And the run? Fuggeddaboutit. If I used the power meter for nothing else other than to rein myself back as I head out, it will have been a great success.
The next question, though, is what should I be going out at? Well, thankfully there are much smarter people out there who have answered that question a million times over. One perfect example is Joe Friel (using the work of Dr. Andy Coggan) who has put together the perfectly titled “How to ‘Cheat’ by Using a Power Meter in an Ironman”. This post beautifully describes what terms like Intensity Factor (IF), Training Stress Score (TSS) and Functional Threshold Power (FTP) mean, but more importantly it answers the question of “How hard should I go?”. The trick however is that he trains much fitter people than I, so I’ve had to extend his work a smidge.
The core of the answers comes from Rick Ashburns’ table of Time to IF ratios expressed in TSS, which you can see here. Unfortunately that chart only displays total bike times at or below 6.5 hours. While that is certainly the goal, it is important to understand the overall progression if it takes you longer. Here is my addition to the chart:
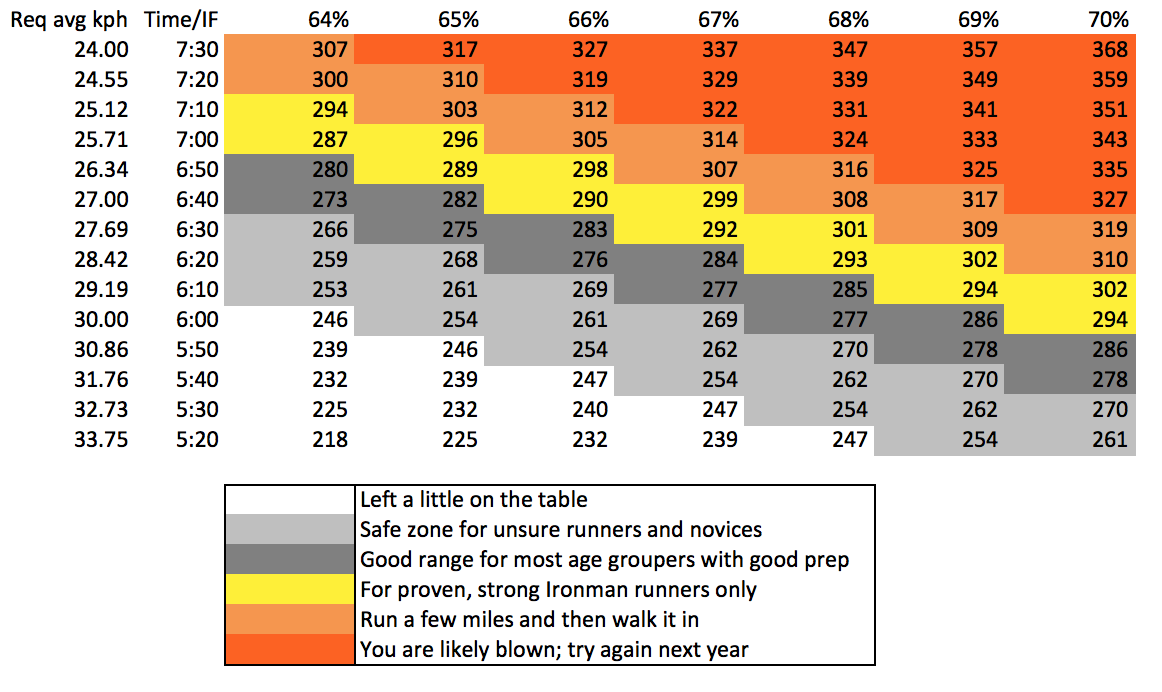 There are three primary differences: I go below 67% FTP, I go above 6.5 hours and I include the average speed (in km/h) required to achieve that time. The trick is not to misinterpret this graph. He’s not trying to say that it’s a whole bunch easier to go a whole bunch faster, but rather, that if your time and your intensity drop you into a white zone, you probably could have gone a lot harder. Now I feel I fall solidly into the dark grey category, so it is probably safe to assume that I will finish between 6 and 7 hours. If I could pull off an average of ~32 km/h and keep my power under 70%, I might just finish under 6 hours. That’s a GINORMOUS if. More likely, I’ll hover in the 68%, 29 km/h range and finish up somewhere between 6 and 6.5 hours. The trick is going to be adjusting constantly on race day in order to hit those ranges.
Guess we’ll see on race day.
